Interactive choropleth with Python and Folium (and some tips)
While working to a geodata analysis project I had the need to quickly and easily create some interactive choropleth maps overlayed to some other raster and vector layers
From Wikipedia: A choropleth map is a thematic map in which areas are shaded or patterned in proportion to the measurement of the statistical variable being displayed on the map, such as population density or per-capita income. Choropleth maps provide an easy way to visualize how a measurement varies across a geographic area or show the level of variability within a region. A heat map is similar but does not use geographic boundaries
After experimenting a little with different libraries, I found that Folium (https://python-visualization.github.io/folium/) was great for my task
So I spent some time to tweak and play with different options and at the end, I've to say that I'm really happy with the results
During the process, I discovered some useful tricks and I want to share my findings with all of you, hoping this will save you precious time
Let's start importing libraries we need:
- pandas (https://pandas.pydata.org/), a high-performance, easy-to-use data structures and data analysis tools for Python
- geopandas (http://geopandas.org/) that extends the datatypes used by pandas to allow spatial operations on geometric types
- folium (http://python-visualization.github.io/folium/) that makes it easy to visualize data that’s been manipulated in Python on an interactive leaflet map
- branca.colormap (https://github.com/python-visualization/branca), an utility module to deal with colormaps
import pandas as pd
import geopandas as gpd
import folium
import branca.colormap as cm
To create a choropleth we basically need 2 things:
a geoJSON file that describes our geographical features. Trough geopandas we can also directly read a shapefile in a geodataframe.
the values to be displayed (as different colours) on the map
The first step is to import a shapefile via geopandas
geopandas will create a geodataframe that will automatically generate a geoJSON when passed to folium. If you want to see the geoJSON, you can use the .to_json method
fname = 'NILZone.shp'
nil = gpd.read_file(fname)
nil.head()
We are not really interested in all of these data
I prefer to keep only the data we need and therefore ID_NIL and geometry. We will use other data from another source
nil=nil[['ID_NIL','geometry']]
nil.head()
Now we load the data file that contains information about the resident population for each Milan neighbourhood
We will use this data to create a choropleth with the percentage of the foreign resident population for each neighbourhood
In this data file we have:
ID_NIL The id of the neightborhod. We use this data as the key to mapping data to our features
NAME_NIL that is the name of the neighbourhood
POP_ITALIAN that is the Italian resident population
POP_FOREIGN that is the foreign resident population
population = pd.read_csv('NIL_POPULATION.csv')
population.head(5)
We need to calculate the percentage of the foreign resident population, so we will add a POP_FOREIGN column to our data file
Again, I'll remove unused data and keep the minimum dataset we need
population['PER_FOREIGN']=round(population['POP_FOREIGN']/(population['POP_ITALIAN']+population['POP_FOREIGN'])*100,2)
population=population[['ID_NIL','NAME_NIL','PER_FOREIGN']]
population.head(5)
Now we will merge this data with the geodataframe, so that we can directly access the data
Folium allows also to read data from another file, but in this way we can overcome a limit of the choropleth method that doesn't allow to use tooltips on single features (we will see this later)
nilpop=nil.merge(population,on="ID_NIL")
nilpop.head()
Now we have all the data we need to create the choropleth map
So, let's start creating the map
TIP 1: Centering the map automatically (based on our features)
To create a Folium map we need to tell at which coordinates the map is centred at the start
Instead of guessing or give a rough value, we can just take the mean of the centre of all our features
This way we will have the coordinates we are looking for
x_map=nil.centroid.x.mean()
y_map=nil.centroid.y.mean()
print(x_map,y_map)
Now we can initialize the map. With Folium we can use different map tiles (OpenStreetMap, CartoDB, Stamen, Mapbox...) and also choose more than one.
TIP 2: Hide tile set from LayerControl
If we specify a tile set directly in folium.Map call, we cannot later hide it from the LayerControl
If we do not specify a tile, it will default on OpenStreetMap
But if 1) we do not specify a tile in the Map constructor, and then 2) add a tile via the TileLayer method, then we can specify the control=False option
mymap = folium.Map(location=[y_map, x_map], zoom_start=11,tiles=None)
folium.TileLayer('CartoDB positron',name="Light Map",control=False).add_to(mymap)
mymap
Now we can use Folium choropleth method to draw our choropleth map
We need to pass:
- geo_data: the geopandas dataframe with the geometries
- data: the dataframe containing values we want to show in the map (in this case it will be the same as geo_data)
- columns the columns inside the data dataframe that contains the keys and the values to be mapped
TIP 3: Using values inside the GeoJSON
Instead of using a separate dataframe for our values, we can also use a value already inside our geo_data dataframe
The tricky part is the key_on parameter
It should start with ‘feature’ and be in JavaScript objection notation, so in our case, it is feature.properties.ID_NIL
- fill_color can be a ColorBrewer palette (http://colorbrewer2.org)
- threshold_scale can be passed to give a different threshold scale.
TIP 4: Using a custom threshold scale
If you don't want to use the default D3 scale (Folium uses Leaflet that uses D3), you can easily pass your own scale via threshold_scale parameter
Instead of using fixed values depending on the data we have, you can use quantile() and tolist() to specify a quantile scale. Or (and we will see this later) you can use a custom colormap
myscale = (nilpop['PER_FOREIGN'].quantile((0,0.1,0.75,0.9,0.98,1))).tolist()
mymap.choropleth(
 geo_data=nilpop,
 name='Choropleth',
 data=nilpop,
 columns=['ID_NIL','PER_FOREIGN'],
 key_on="feature.properties.ID_NIL",
 fill_color='YlGnBu',
 threshold_scale=myscale,
 fill_opacity=1,
 line_opacity=0.2,
 legend_name='Resident foreign population in %',
 smooth_factor=0
)
mymap
Now we have a nice choropleth map but it's completely static. How can we add some interactivity?
The choropleth method in Folium doesn't allow us to interact with the different polygons so we need to find another way
And here's come the trick
TIP 5: Overlay the geographical features again this time using folium.features.GeoJson method
We can use the same geodataframe to draw the features using a different method
This way we can add some interactivity to the map
And most important, we can add a tooltip that can also show for each feature the associated data inside the geoJSON
We will use three useful parameters for this method:
- highlight_function: allows to specify a function mapping a GeoJson Feature to a style dict for mouse events
- style_function: allows to specify a function mapping a GeoJson Feature to a style dict
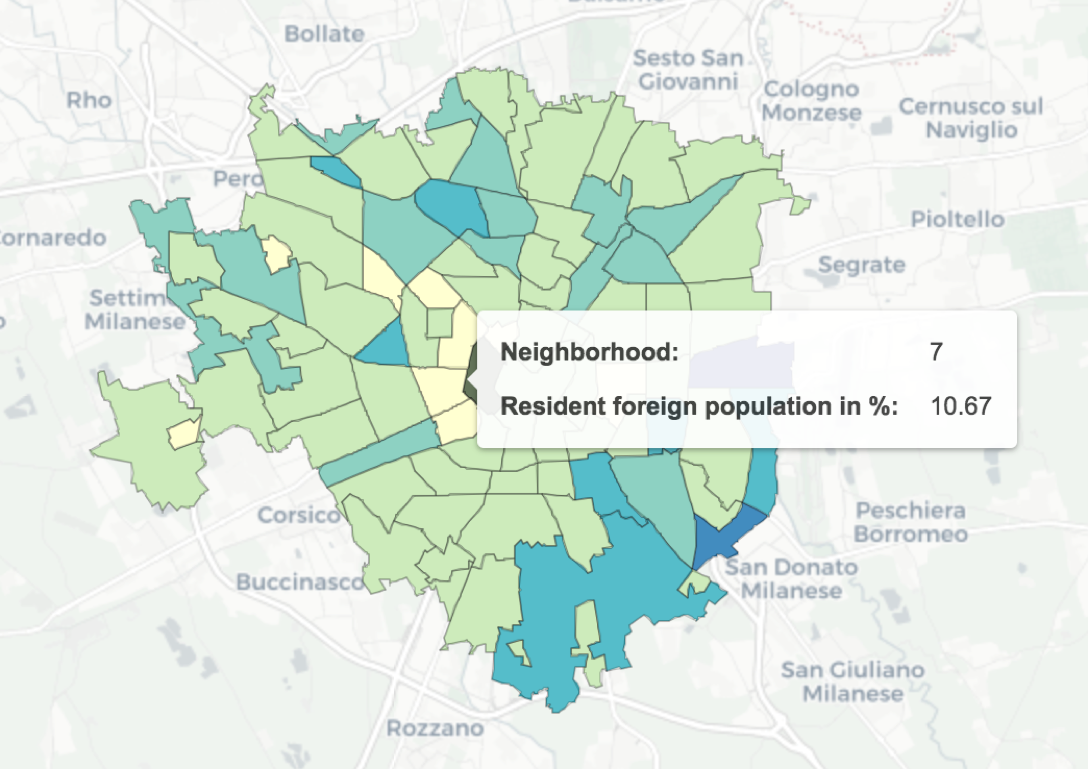
- tooltip: allows to display a text when hovering over the object
As a tooltip, we will use the folium.features.GeoJsonTooltip method that allows to access data inside the GeoJson. In this way, and for each feature, we can get the neighborhood name and resident foreign population value.
TIP 6: Use the keep_in_front parameter when you have multiple map layers
We want the NIL group to be always in front as this layer gives us the interactivity
If you don't specify that parameter, when you hide the choropleth and then you show it again, it will lay over the NIL group and we lost the highlight feature and tooltips
style_function = lambda x: {'fillColor': '#ffffff',
                            'color':'#000000',
                            'fillOpacity': 0.1,
                            'weight': 0.1}
highlight_function = lambda x: {'fillColor': '#000000',
                                'color':'#000000',
                                'fillOpacity': 0.50,
                                'weight': 0.1}
NIL = folium.features.GeoJson(
    nilpop,
    style_function=style_function,
    control=False,
    highlight_function=highlight_function,
    tooltip=folium.features.GeoJsonTooltip(
        fields=['NAME_NIL','PER_FOREIGN'],
        aliases=['Neighborhood: ','Resident foreign population in %: '],
        style=("background-color: white; color: #333333; font-family: arial; font-size: 12px; padding: 10px;")
    )
)
mymap.add_child(NIL)
mymap.keep_in_front(NIL)
folium.LayerControl().add_to(mymap)
mymap
We have finished! Here is our interactive choropleth map made with Python and Folium
There is more...
We can obtain a similar result also without using the choropleth function and use custom styling for our GeoJSON features
We do it trought the style_function thing we saw before. This function, in fact, can also access the GeoJSON, read the values and set an appropriate fillColor based on a colormap
A quick way to get a colormap (based also on ColorBrewer) is to use branca.colormap.linear
In fact, we can easily get a LinearColormap as well as a StepColormap
Here is a LinearColormap (that is the YlGnBu in ColorBrewer)
colormap = cm.linear.YlGnBu_09
colormap
That can be easily be transformed in a StepColormap (in this example, 10 steps)
colormap = cm.linear.YlGnBu_09.to_step(10)
colormap
Here we define our threshold values based on quantiles
We will use this one for our choropleth
colormap = cm.linear.YlGnBu_09.to_step(data=nilpop['PER_FOREIGN'], method='quant', quantiles=[0,0.1,0.75,0.9,0.98,1])
colormap
So, let's start again, this time without using the choropleth method
TIP 7: Use style_function to assign the right colormap colors to the features
To obtain a choropleth map, we assign a fillColor to each feature, based on the 'PER_FOREIGN' value
As we said, the style_function allows us to access GeoJson data so that we can call the colormap function with the value to obtain the corresponding fillColor
mymap = folium.Map(location=[y_map, x_map], zoom_start=11,tiles=None)
folium.TileLayer('CartoDB positron',name="Light Map",control=False).add_to(mymap)
colormap.caption = "% of foreign resident population"
style_function = lambda x: {"weight":0.5,
                            'color':'black',
                            'fillColor':colormap(x['properties']['PER_FOREIGN']),
                            'fillOpacity':0.75}
highlight_function = lambda x: {'fillColor': '#000000',
                                'color':'#000000',
                                'fillOpacity': 0.50,
                                'weight': 0.1}
NIL=folium.features.GeoJson(
        nilpop,
        style_function=style_function,
        control=False,
        highlight_function=highlight_function,
        tooltip=folium.features.GeoJsonTooltip(fields=['NAME_NIL','PER_FOREIGN'],
            aliases=['Neighborhood','% of foreign resident population'],
            style=("background-color: white; color: #333333; font-family: arial; font-size: 12px; padding: 10px;"),
            sticky=True
        )
    )
colormap.add_to(mymap)
mymap.add_child(NIL)
mymap